At Labguru, we’re constantly working to improve our user experience and simplify research lab management. This quarter, we introduced Labguru Dashboards, as well as a few improvements to existing features. This article will present our most significant recent updates.
Labguru Dashboards
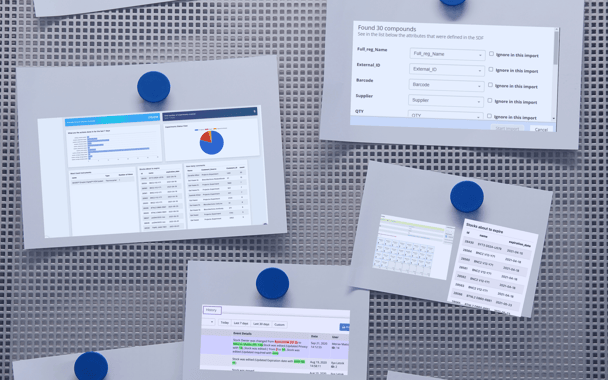
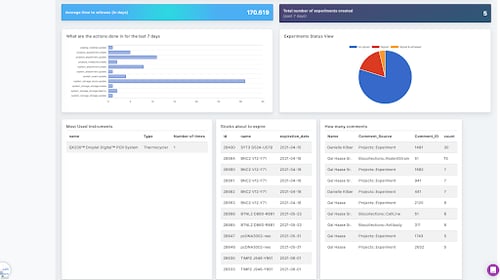
Dashboards is a new add-on BI (Business Intelligence) solution to Labguru ELN, made for creating and visualizing reports. Labguru Dashboards allows users to query data stored in their Labguru account, create visual reports out of it and derive data-driven decisions, making your lab more efficient.
Key Benefits
Easy and quick to integrate: Dashboards comes with a repository of ready to use pre-designed SQL queries and dashboards. After acquiring the tool, you can have a set of functioning dashboards within minutes. You can also create new SQL based queries that can be specific to your requirements
Answer Complex Questions: Dashboards offers the Scriptor tool, which allows you to process query results with code scripts (Python, Ruby or C#) to achieve more precise results.
Multiple visualization options: You can present your query results in various forms: line, bar, column, pie, area, or scatter charts, and even fact and percentage bars.
Boosting All Areas of Research Lab Management
- Visualize and analyze experimental results — collect data from data files and forms in Datasets and visualize them.
- Track Equipment — create equipment utilization reports including most used instruments, number of non-operational days per instrument, down times, equipment usage per project and more.
- Get Inventory insights — understand what are your most used or unused materials, track samples intake and consumption rates, receive alerts on expiring stocks and calculate material cost per month or per project.
- Get operational insights — track task completion across your lab, stay updated on current workload per lab member, and receive conclusions such as what is the average time to complete an experiment according to protocol.
Stock History Page
We added a new page in our sample management system. The stock view now includes a tab that shows the entire history of the stock chronologically since its creation.
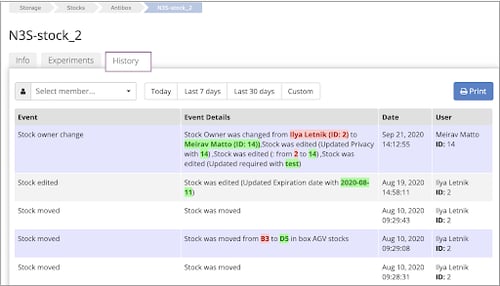
Keeping track of supplies becomes much easier now that you can see all the actions performed on them: creation, location change, ownership changes, usage in experiments, editing stock info, aliquoting, dispatch and consumption. For each such action, you can see details with reference to the previous value (e.g. “Stock Owner was changed from John to Susan), the date of the action, and the user who performed it.
Schedules
Labguru’s Schedules feature simplifies scientific project management by enabling users to plan equipment sessions and link them to events on the calendar. If you need to, you can select several instruments and schedule them for the same event.
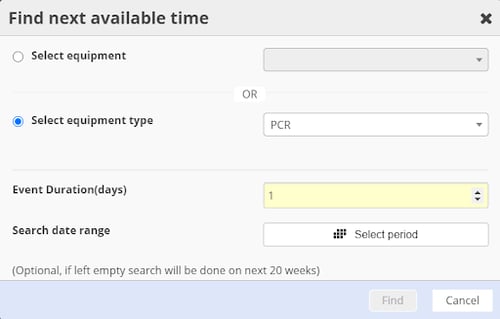
We also added a new scheduling wizard that helps you find the next available time for equipment you want to use.
You can select a specific instrument or instrument type and the wizard will find you the next available time for your session, and create the event for you.
SDF Mapping
The Chemistry Module allows you to upload compound information in various forms and gather them in one place. Compounds can be imported in bulk using Excel or SDF files.
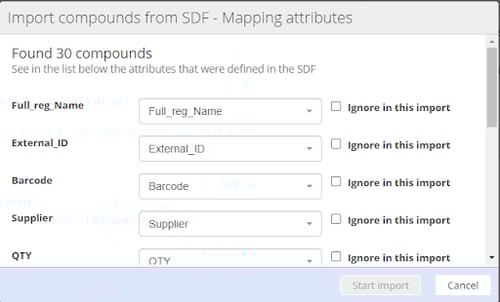
We’ve added a new feature - SDF mapping. Now, when compounds are imported via an SDF file, a field mapping window appears as the first step of the import process. The attributes from the SDF file are automatically paired with existing Labguru fields when there is a match. All the data fields in the file are presented and can also be further allocated manually to new or existing fields in the Labguru collection.
For more information about research lab management software updates, click here:

%20(4).png)