What are Gantt charts?
 A Gantt chart is a type of visualized bar chart that illustrates a project timeline and progress. This chart lists the tasks to be performed on the vertical axis, and time intervals on the horizontal axis. Gantt charts were first created in 1896 and later revised by Henry Gantt in the early 1900s. Once personal computers started to be in use, Gantt charts became one of the most widely used management tools for project scheduling and control, including scientific project management.
The importance of planning for scientific project management
Preclinical research bears significant costs. Constructing a good research plan helps you clearly define your vision and refine your scientific and business goals. Lack of planning preclinical research projects may result in considerable time and budget deviation. Therefore, scientific project management is highly important for emerging biotech companies especially when budget is limited.
When you start planning a research project you need to carefully think of all the details required for succeeding. You need to decide on the project’s time frame and create a proper timeline for each part within the project. It is important to be realistic about your time frames and try to leave buffers as sometimes things do not work as planned. Today, most laboratories, in pharmaceutical companies or academia, use Electronic Lab Notebooks to document their projects. In addition, it is recommended to use Gantt charts to monitor your project progress vs. the plan and to keep your project timeline organized.
Tracking Your Projects with Gantt charts
Gantt charts make scientific project management easier, as they enable you to visually track how a project is progressing in comparison to the plan, and see the full project picture. In addition, you can manage the entire project process and ensure that your research team is in sync and working within the project’s time frame. You can choose to have two separate applications to manage your research projects- an ELN and an additional project management tool. However, this might result in mundane work of searching for changes and redundant documentation by manually updating an Excel sheet or external visualization applications.
Implementing an ELN platform that includes Gantt Charts allows you to seamlessly manage cross-functional efforts within your lab, all in one application:
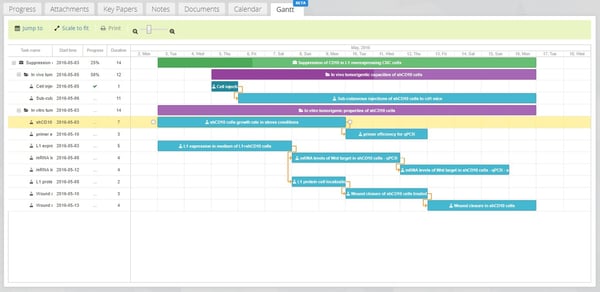
- Start date and duration of tasks (experiments) in the Gantt chart are added automatically when the experiments are created in the ELN.
- Update experiments start date and duration fields on both the Gantt chart and the experiment page in a single action. Updating in one page automatically updates the other.
- Save time and update the work plan by simply dragging or extending the experiments bar on the Gantt chart and vice versa.
- Create dependencies by connecting between experiments and folders.
- Visually see completed experiments and folders to easily track progress.
Once your Gantt chart is in sync with your ELN it’s fairly easy to keep track of your research progress. Labguru offers a Gantt chart module that will help you organize and plan your research, all in one place.
Click 'Book a Demo' below to learn more about scientific project management.
%20(4).png)
