Products
Labguru Dashboards
As life science research becomes increasingly data-driven, scientists find themselves facing the challenge of processing big data. Labguru Dashboards is an add-on solution to the Labguru ELN, created to help scientists centralize, analyze, and visualize information to receive better and faster insights.

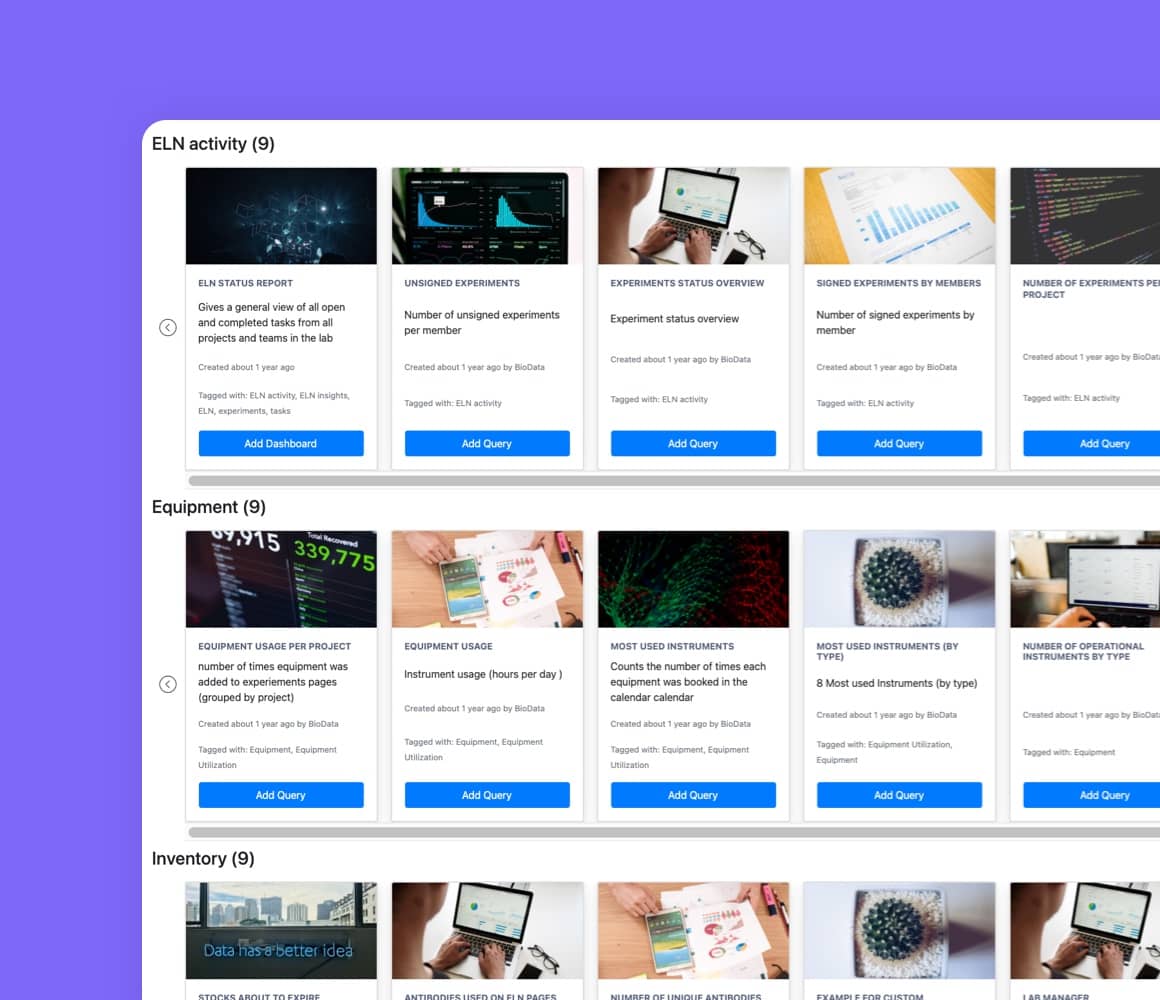
Select Your Queries
- Choose from a constantly-updating collection of ready-to-use queries and add them to your list.
- Create new SQL-based queries customized for your lab’s specific needs.
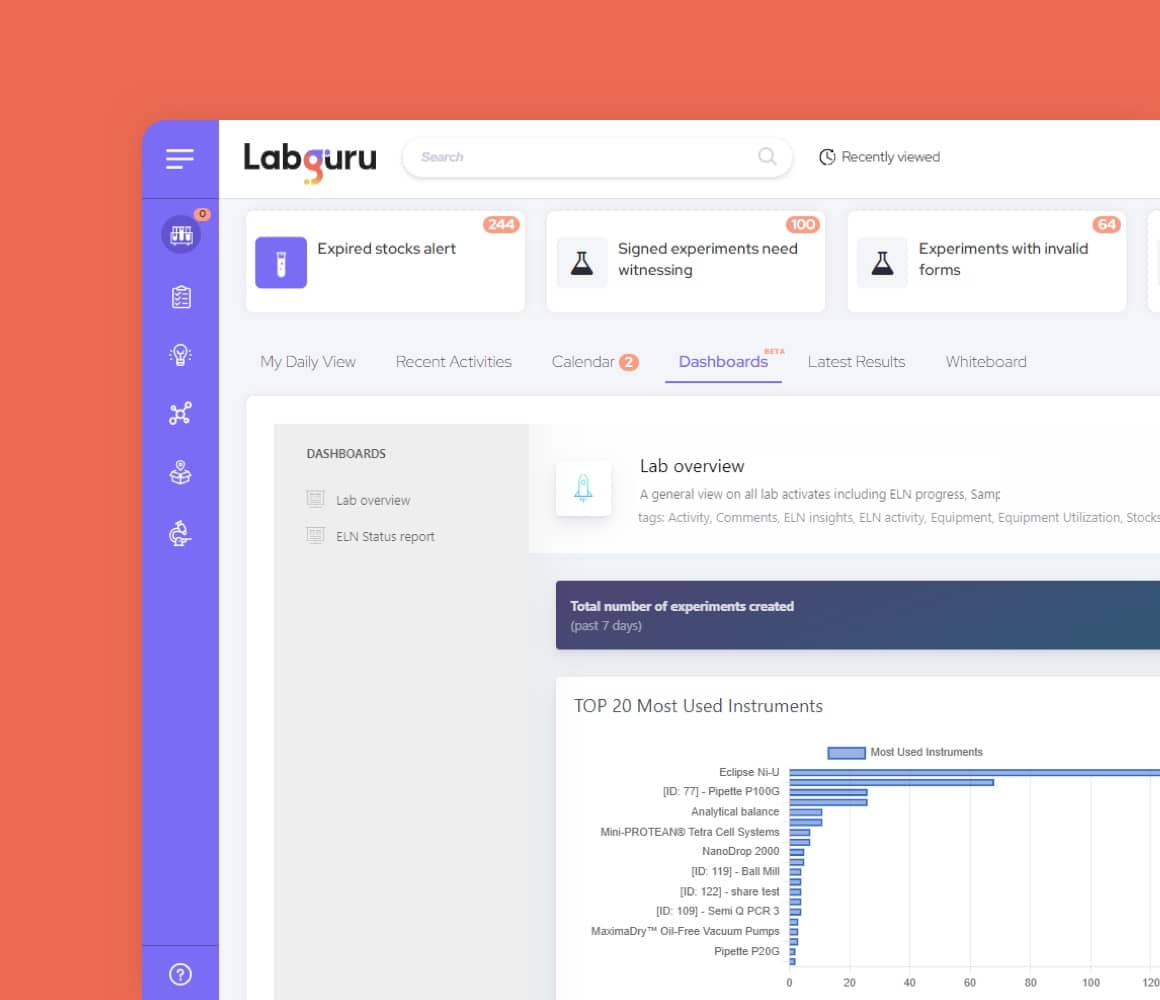
Visualize Your Results
Great data only generates great insights when visualized properly. Labguru empowers you to keep up with the latest scientific advances by selecting from a wide variety of visualization tools.
- Present your query results in line, bar, column, pie, area
- Scatter charts, or turn your data into facts or percentage bars.
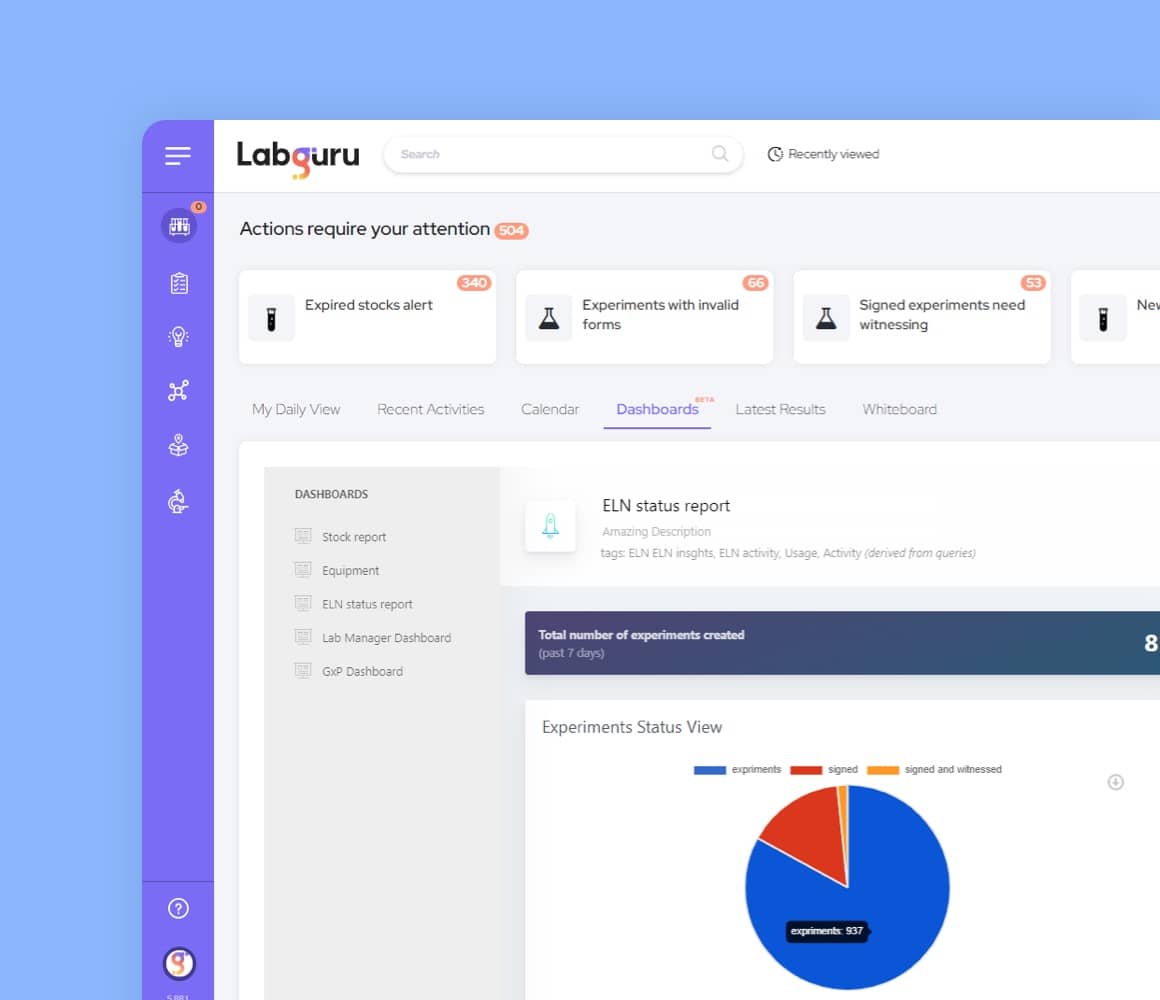
Create Your Dashboard
Groundbreaking science requires the flexibility to customize your data management platform to meet your unique needs.
- Select your required queries and assemble them into a dashboard.
- Reposition to create the perfect order. You can create as many dashboards as you need.
Download the Labguru Dashboards whitepaper here

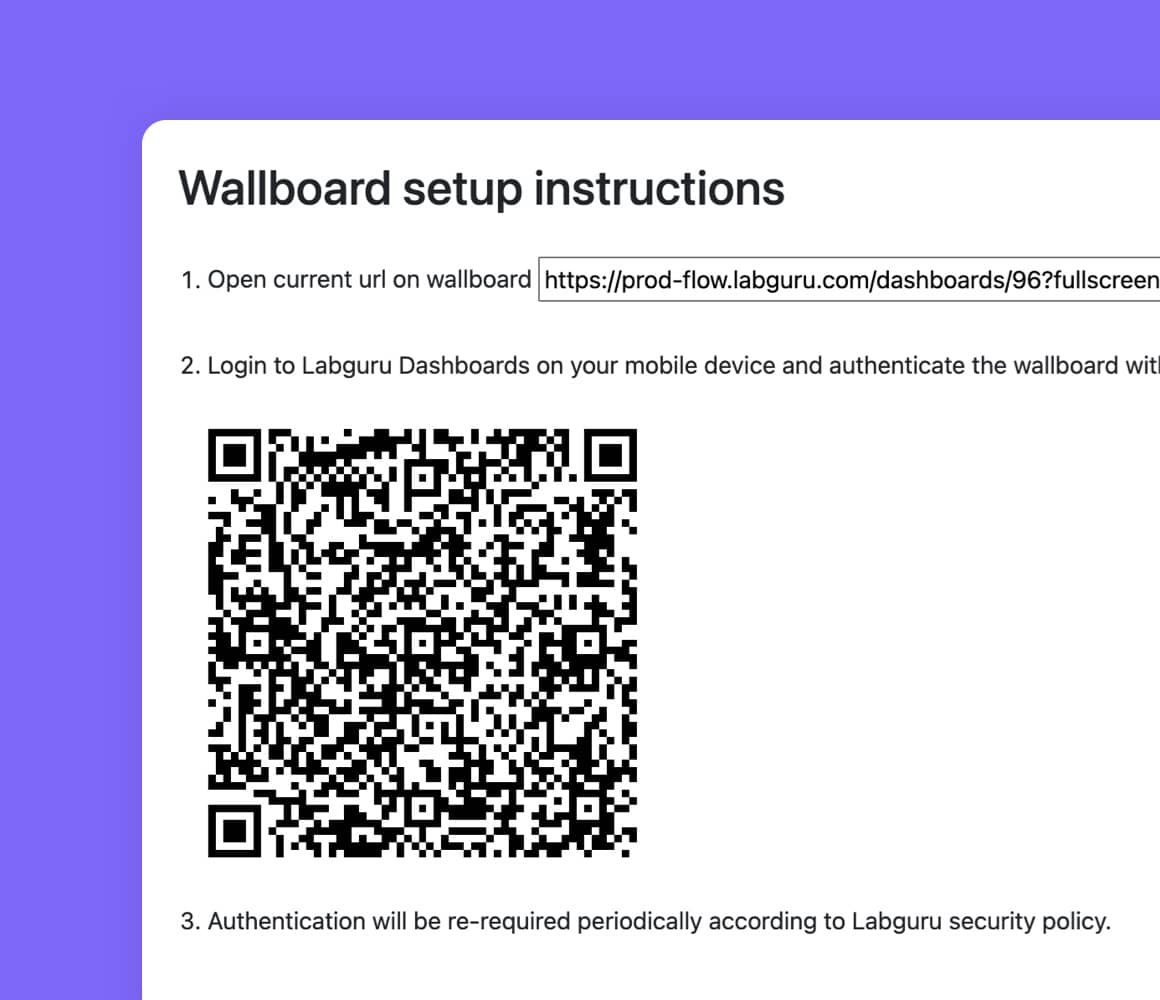
Share Your Dashboard
Modern science relies on extensive communication and collaboration.
- Post the dashboard to your Labguru workspace, keeping all users in your account updated with real-time data.
- Create a unique wallboard link for collaborators or external displays.
- Export and send collaborators reports and images easily.
Key Benefits
Quick implementation
Our query repository allows you to start working with Dashboards and see results immediately.
Customization
Our solution can be easily tailored to your needs using custom SQL queries, modular dashboards, and various visualization options.
Constant, knowledgeable support
Our customer success team is made up of scientists with experience in all life science fields. They are always available to help you get the most out of Dashboards and provide personalized solutions.
Communication and collaboration
Dashboards allows you to keep all lab members updated by showing the reports on their Labguru homepage, as well as easily share information with your collaborators.
Labguru Dashboards enables you to approach big data not as a challenge, but as a tool that will help you accelerate your research and do more science
We are here to make data analysis easy, provide you with better and faster insights, and improve your team communication and project management.
