Liquid Chromatography-Mass Spectrometry (LC/MS) instruments are widely used in metabolomics and proteomics research. With enormous amounts of data in various formats, there is a high demand for better solutions to handle and analyze LC/MS data. Once mass spectrometry data is extracted, it is imperative to use algorithms and computational tools in order to gain meaningful information from the output. After processing the initial data, it is necessary to use statistical analyses and visualization tools. To date, it is difficult to transfer the data collected from LC/MS instruments and build accessible datasets that can be analyzed by other software, not provided with the mass spectrometry instruments, which makes it hard to allow others to review it and use the data.
Attempting to solve this problem, foundations like Allotrope and AniML were formed in order to help researchers create a standardized format for scientific data. Once scientific data is in a standardized format it is much easier to search, share and extract relevant data, while also increasing data integrity and reproducibility.
In addition to keeping all the data from LC/MS instruments in one format, it is also imperative to keep the raw data and code linked in order to later enable researchers to later locate and access the raw data of a specific figure or chromatogram.
Open source computational methods and tools to process and analyze LC/MS datasets
One of the most popular options, used by many is R language. R provides a wide variety of statistical and graphical techniques and is highly extensible. R programming enables to create computational tools to perform required analyses. R programmed modules enable researchers to perform various personalized LC/MC data analysis workflows. There are a few R programmed modules that enable LC/MS analyses and you can find the one fits your needs in the Bioconductor website, an open source software for bioinformatics or write your own R function to cater your needs.
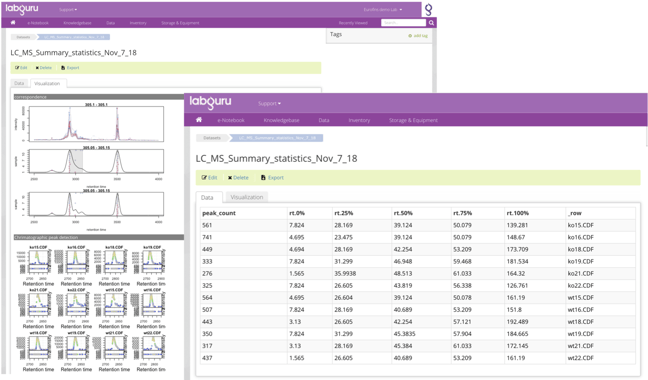
Experimental data from machines like HPLC and MS can be uploaded to Labguru and turned into datasets.
Labguru offers an R library that allows users to upload or download datasets from their account into R, run on them their own personal LC/MS scripts (or any other scripts) and then upload the results and figures back to their account together with the code used to generate them. This allows researchers to keep all the relevant information linked and in context.

Mass spectrometry analysis
With datasets, users can interact with the actual results of experiments that are in data files, allowing them to visualize and connect it to the relevant places in Labguru. For example, machine output files such as XML or CSV can be parsed and uploaded to Labguru as a dataset. The relevant chromatograms created throughout the analysis then can be associated with the dataset, linked back to the relevant experiment or samples and to be presented in the relevant reports.
Datasets also allow users to perform searches based on the data itself and group together desired results from different origins to help in big analyses. Datasets can be created in a variety of ways: from spreadsheet and form elements, from data files like Excel, csv or xml and more.
Another advantage is that once the LC/MS datasets were created and uploaded to Labguru, the analysis process can be triggered automatically via Labguru’s workflow engine, and your chromatograms will be automatically attached to the relevant reports. This can increase data integrity, ensure reproducibility and eliminate human error and tedious paperwork.
To learn more about how to create and integrate mass spectrometry data analysis in Labguru – Contact us.
Read more blog posts:
%20(4).png)