In the past few weeks, we have been talking with our customers in biopharmaceutical companies to better understand how they are dealing with vast amounts of data, working with R programming and storing the data and generated figures. Among the researchers we talked with you can find researchers conducting NGS experiments, cell line clustering, genetic and genomic research and more. After going through the information shared with us, it is now apparent that using an Electronic Lab Notebook and creating datasets can solve quite a few obstacles and streamline research data management and communication among lab members.
Analyzing
The problem:
Labs, academic and industrial, need to analyze the data they gather and generate during research work. The amount of data that is created, gathered and processed is growing at a rapid rate, and research data management is becoming quite difficult. The data is stored on external servers, and its size can be in excess of terabytes.
Today’s instruments come with analytical capabilities to perform complex experiments and calculations. However, gone are the days where you can use the results obtained from these instruments on a simple piece of paper, as the results contain vast amounts of data. Even analyzing via excel sheets is not realistic anymore. Raw data can be captured straight from the instruments and tools, afterward stored together with the interpreted results, figures, and annotations from the analysis of the data. Today, most instruments, offer built-in data analysis tools. If your data is in standard form, using the instrument’s software for analysis will work for you. However, usually, the data that is generated is not in a standard form, and it will require analysis, processing, and calculations using individual scripts and algorithms using specialized tools like R and Python programming languages to help you sort through your data and generate useful data.
According to the R website, R is an open source language and environment for statistical computing and graphics. R provides a wide variety of statistical (linear and nonlinear modeling, classical statistical tests, time-series analysis, classification, clustering, etc.) and graphical techniques, and is highly extensible. Various R programming packages allow researchers to analyze genomic data and facilitate the inclusion of biological metadata in the analysis( literature data from PubMed, annotation data from Entrez genes).
Once the analysis process is done, the outcome figures are shared with the researchers. Saving the analyzed data and its results can be a challenge due to its vast amount and size.
The solution:
You can now transfer data from your instruments directly to Labguru Electronic Lab Notebook using the Upfolder feature. Automation does not have to end there. Labguru ELN enables you to build complex and automated data pipelines and create datasets. Also, Labguru lets you run preconfigured R scripts on your datasets and automatically embed the results in the results page.
Tracking
The problem:
However, using R solves only part of the problem. The majority of the researchers we talked with, need to combine several analytical, statistical and processing techniques, and perform many calculations to get to the wanted results or get any comprehensible visuals from these results. They all stated that the main issue they are dealing with is keeping their results and code linked in a proper manner that will enable them to access the code of a specific figure later.
To date, they usually track the figures and the associated datasets and code by searching their directories in which they keep their documentation. Many confessed that maintaining those directories organized is difficult and they admitted they tend to get messy.
The solution:
The solution to the issues raised above can be availed by using an Electronic Lab Notebook which enables researchers and bioinformaticians to upload and link the generated datasets and communicate within the ELN.
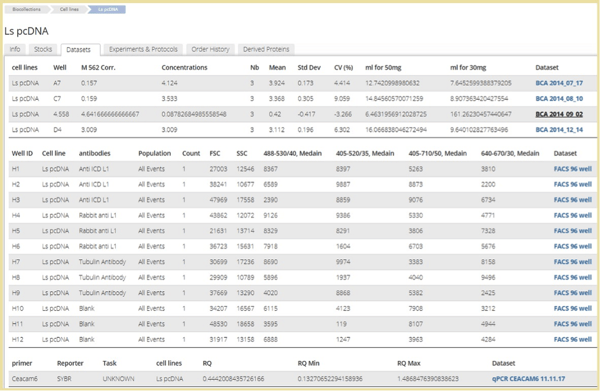
Dataset related to a cell line
Data files in the form of Excel or text that are added to experiments pages can be turned into datasets on which you can run an analysis and establish a theory. With Datasets users can link the outcome of experiments to the samples (items) from the inventory module, allowing users to view the actual results in the item’s page and have the option to compare results of different experiments. Datasets also enable users to perform searches based on the data and group together desired results from different origins to help in significant analyses. You can also search through all datasets in the account by clicking on one of the data-points. Labguru’s research management system will find all the locations where this data-point appears and will present it in a new page with all similar points found with and their vectors. If the data-point you clicked on is an item in your inventory, you’ll be able to go directly to the item’s page, by clicking on its name.
For example, Labguru will save the algorithm, so that you can perform the same calculation using different input datasets.
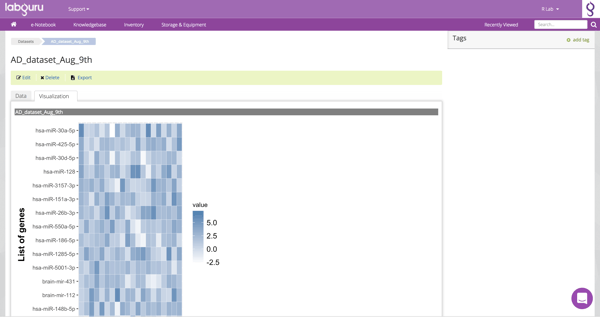
NGS Dataset
Communicating
The problem:
Another issue that was raised during our conversations was the need for better communication. In many of the labs researchers are performing the experiments and collecting the data; however, bioinformaticians are analyzing the data and dealing with programming, structuring, as well as, cleaning up the data. They prepare the data for analysis from the raw form and then analyze it. Bioinformaticians work on the creation of data algorithms and specialized computer software to identify and classify the components of the biological system, such as DNA and protein sequences. Handling data that someone else created is challenging, and it is highly essential to ease communication and data sharing between the researcher and the bioinformatician. Some of the researchers we talked to stated that the interface is usually done by emails and is not linked to the collected data. Later it is almost mission impossible to track the communication and link it to the data.
The solution:
Using an ELN to communicate with your group members enables you to keep your communication within a context and linked to the experiment. Connecting your interactions with the relevant data will save you lots of time in the future trying to locate the emails sent about a specific experiment.
Labguru offers various means to communicate with other members of the group:
- Writing inline comments in an experiment or a protocol’s page. You can add comments directly attached to a specific sentence inside a section in an experiment or a protocol. Any group member entering that page will see the comment and write a reply. You can also choose members that will receive an e-mail notification with the comment.
- Posting comments in the discussion sections of any of Labguru’s modules pages (Experiment, Protocols, Documents, Recipes, Collection items, Stocks). Posted comments will be visible to group members visiting that page, but you can also choose to send email notifications to selected members.
- Creating tasks. Users can assign tasks to other group members connected directly to the project. You can also designate another lab member to the task, and send him a notification via email. The assignee will also see the task appearing in his dashboard. You can create and see tasks even in the projects’ page, folder and experiment, in the e-Notebook module, in the different modules of the Knowledge Base and each collection item info page. Tasks created there can be visible only to members that are part of that specific project/document.
Save your organization time and money by implementing a multifunctional scientific data management software with features that help you analyze and visualize vast amounts of data generated from your research, integrate data sources in one place, and streamline your team communication within context.
Make Your Research Data Management More Efficient
Save your organization time and money by implementing a multifunctional scientific research data management software with features that help you analyze and visualize vast amounts of data generated from your research, integrate data sources in one place, and streamline your team communication within context.
To schedule a demo and learn more about how you can improve your lab efficiency
