.png?height=380&name=Blog%20featured%20image%20(2).png)
In life science laboratories, inventory management is a critical part of ensuring that research and experiments can be carried out efficiently and effectively. Proper inventory management involves forecasting the demand for the various materials, reagents, and equipment used in the laboratory, as well as forecasting the lead time for these items from the supplier.
To forecast demand and lead time for inventory items in a life science laboratory, Labguru uses a combination of time series forecasting methods and supplier relationship management (SRM) techniques. For demand forecasting, Labguru leverages machine learning models such as XGBoost (eXtreme Gradient Boosting), time series forecasting methods such as ARIMA (Autoregressive Integrated Moving Average), as well as those methods that are specifically designed to handle intermittent demand data, the Croston method and the Simulated Annealing-Based Croston method, as well as other machine learning models.
For lead time forecasting, Labguru uses SRM techniques to analyze the performance of the supplier and estimate the lead time for each inventory item. This involves evaluating historical data on the supplier's delivery times, the number of orders they are currently processing, and any other factors that may affect their lead time. This data is used to build a forecasting model that can predict the lead time for each inventory item.
The demand and lead time for inventory items change over time due to factors such as changes in research projects, changes in the availability of materials, or changes in the performance of the supplier. Labguru is a continuous-review inventory system in which the inventory level is monitored on a continuous basis so that a new order can be placed as soon as the inventory level drops to the reorder point. Thus, ensuring that the laboratory has the right inventory on hand to meet its needs and avoid shortages or excesses.
Reorder Point
Based on the forecasted demand and lead time and subject to the desired service level, Labguru will determine the appropriate time to place an order. A reorder point is a specific level of inventory that triggers the need to place an order for more inventory. This point is determined by considering factors such as the rate at which the inventory is used, the lead time for restocking the inventory, and the desired level of safety stock. The goal of setting a reorder point is to ensure that the laboratory has enough inventory on hand to meet demand, without running out, while also avoiding excess inventory that can result in waste and additional costs.
To determine the reorder point based on demand forecasting and supplier lead time forecasting, Labguru uses the following steps:
- Forecast the demand for the inventory item using an optimal model based on the nature of the demand. Labguru will use machine learning models or time series forecasting models. When the demand data is intermittent, Labguru will use a time series forecasting method that is specifically designed to handle intermittent demand data, such as the Croston method or the Simulated Annealing-Based Croston method.
- Forecast the lead time for the inventory item from the supplier using supplier relationship management (SRM) techniques. This can involve collecting data on the supplier's delivery times, the number of orders they are currently processing, and any other factors that may affect their lead time.
- Determine the lead time demand based on the demand and lead time forecasts. The lead time demand is the amount of inventory that is expected to be used during the time between placing an order for more inventory and the arrival of the new inventory.
- Determine if more stock needs to be reordered, given the existing inventory, the forecasted demand and lead time, and the desired service level set by the laboratory.
- Continuously review inventory levels. Every time an item is withdrawn from inventory, Labguru will recalculate the reorder point, compare it to the existing and in-transit inventory levels, and determine whether an order should be placed.
By using continuous demand forecasting and supplier lead time forecasting to determine the reorder point for inventory items, Labguru laboratory inventory management software ensures that the lab has the materials, reagents, and equipment it needs to carry out its research and experiments without running out of stock or overstocking.
Service Level
In inventory management, the ‘service level” is a measure of the percentage of demand for an inventory item that is met by the available stock. It is commonly used to assess the performance of an inventory system and identify opportunities for improvement.
To calculate the service level for an inventory item, you can use the following formula:
Service Level = (Total Demand - Stockouts) / Total Demand
The total demand is the total number of units of the inventory item that were demanded over a specified period. The stockouts are the number of units of the inventory item that were not available when they were demanded.
For example, if the total demand for an inventory item was 100 units and there were 10 stockouts during the specified period, then the service level would be calculated as follows:
Service Level = (100 units - 10 units) / 100 units = 90
This means that 90% of the demand for the inventory item was met by the available stock.
The service level is an important metric in inventory management, as it provides insights into the effectiveness of the inventory system in meeting the demand for inventory items. A high service level indicates that the inventory system is performing well, while a low service level may indicate that there are opportunities for improvement, such as increasing the safety stock or improving the demand forecasting accuracy.
Setting the desired Service Level for your lab
The desired service level is set by the laboratory and impacts the reorder point of new inventory. To set the desired service level for inventory management in the Labguru system, the laboratory needs to consider the specific requirements and constraints of the inventory system, as well as the potential impact of different service levels on the performance of the laboratory.
When setting the desired service level, it is important to balance the need to meet the laboratory demand with the cost of maintaining an adequate inventory. A higher service level means that a higher percentage of demand will be met, which can improve satisfaction and performance, and reduce the risk of delays due to stockouts. However, a higher service level also means that more inventory must be kept on hand, which can increase the cost of inventory storage and handling.
It is important to regularly review and adjust the desired service level to ensure that it remains appropriate for the current business environment and inventory system. Factors such as changes in demand, changes in the availability of inventory items, or changes in inventory carrying costs may require adjustments to the desired service level.
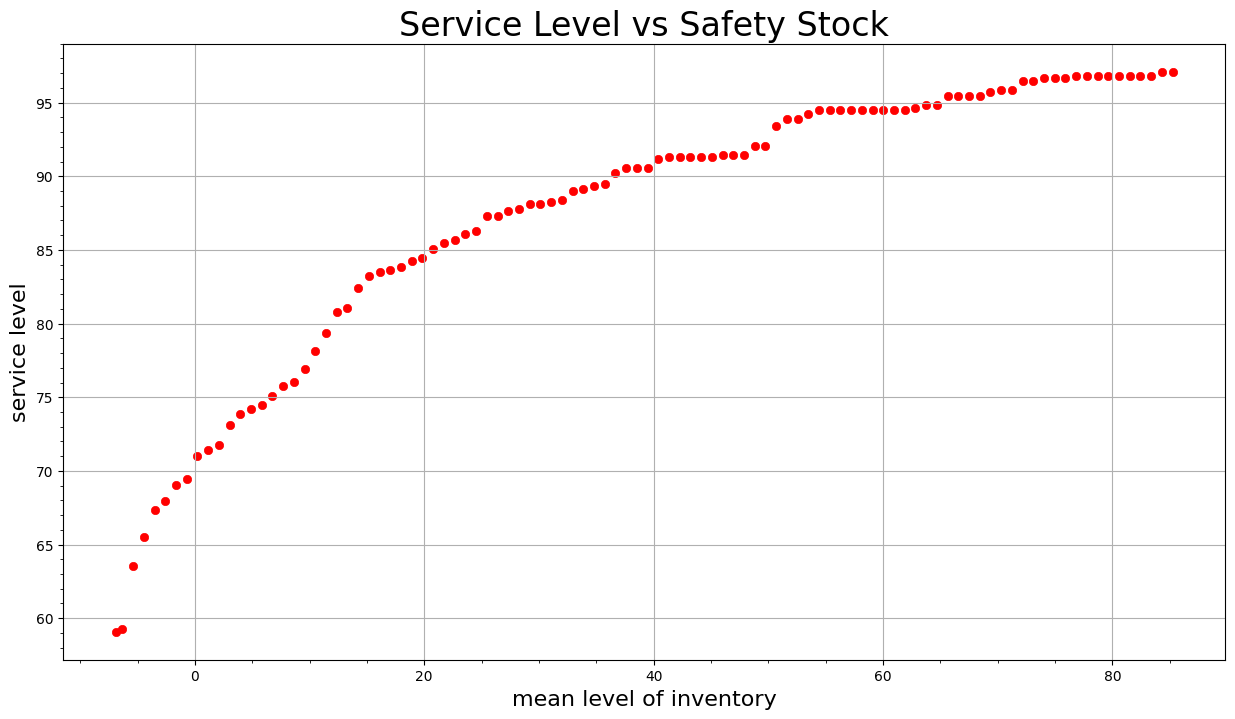
Sensitivity analysis
Sensitivity analysis is a technique used to determine how changes in one or more variables can affect the outcome of a given situation. In the context of inventory management, sensitivity analysis of inventory levels to service level can help the laboratory identify the optimal inventory level that will provide the desired level of service while also minimizing costs. Labguru provides a chart of inventory levels vs. service levels. The chart allows the laboratory to examine how changes in inventory levels impact the probability of having sufficient inventory to meet demand, as well as the potential costs associated with excess inventory or stockouts. By comparing the results of different scenarios, the optimal inventory level can be determined.
Forecasting Demand and Lead Times
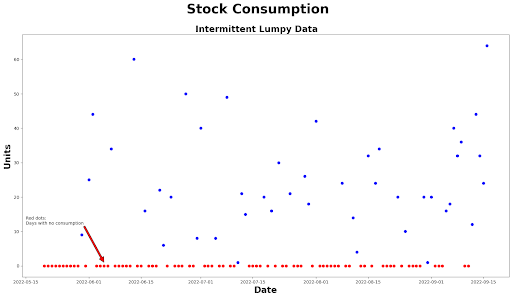
Intermittent demand
The demand in the laboratory typically follows an intermittent pattern. Intermittent demand, also known as sporadic demand or lumpy demand, is a type of demand pattern that is characterized by low demand rates and large fluctuations in demand from period to period. It is common in industries where the demand for a product or service is highly variable and unpredictable, such as the automotive industry, the aerospace industry, or the healthcare industry.
Intermittent demand presents a challenge for inventory management, as it is difficult to forecast and plan for the future demand for a product or service. Traditional time series forecasting methods, which are designed for smooth and regular demand data, are often not suitable for forecasting intermittent demand.
Forecasting intermittent demand
To address the challenge of forecasting intermittent demand, specific forecasting methods have been developed that are specifically designed to handle intermittent demand data. These methods typically use statistical techniques and optimization algorithms to estimate the future demand for a product or service based on its past demand patterns. Examples of these methods include the Croston method, the Simulated Annealing-Based Croston method, the Regularized Croston method, and the Modified Croston method.
To determine which method is best for forecasting intermittent consumption of inventory, it is recommended to experiment with different methods and compare their performance. This can be done by splitting the demand data into a training set and a test set and then using the training set to fit different forecasting models. The models can then be evaluated on the test set by comparing their forecasts to the actual demand values.
It is also important to consider the specific characteristics of the demand data when selecting a forecasting model. For example, if the demand data has a strong seasonal pattern, then a model that accounts for seasonality, such as the Simulated Annealing-Based Croston method, may be more suitable. On the other hand, if the demand data has a high level of uncertainty, then a model that can handle uncertainty, such as the Regularized Croston method, may be more appropriate.
Ultimately, the best model for forecasting intermittent consumption of inventory will depend on the specific characteristics of the demand data and the requirements of the forecasting application.
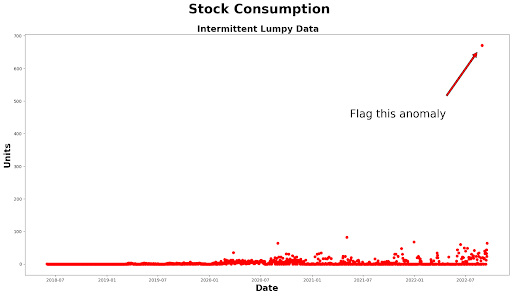
Anomaly detection
Anomaly detection in laboratory demand forecasting refers to the process of identifying unusual or unexpected patterns in the demand data that may indicate a deviation from the expected demand trend. Anomalies can be caused by a variety of factors, such as sudden changes in workload, unplanned events, or data errors.
Anomaly detection is an important step in demand forecasting, as anomalies can have a significant impact on the accuracy of the forecasts. If anomalies are not detected and accounted for, they can lead to forecast errors that can affect inventory management.
To detect anomalies in laboratory demand data, Labguru uses a variety of statistical and machine-learning techniques:
- Statistical methods: implementing statistical tests, such as hypothesis testing or outlier detection, to identify anomalies in the data. For example, the Z-score or the Grubbs test identifies data points that are significantly different from the expected values.
- Machine learning methods: using algorithms, such as clustering, classification, or regression, to learn the normal behavior of the data and identify deviations from that behavior.
- Hybrid methods: combing statistical and machine learning techniques to improve the accuracy and robustness of anomaly detection.
Data Analysis
Labguru’s inventory management system helps identify trends and patterns in the lab's inventory usage, which can provide valuable insights for planning and decision-making. For example, forecasting can help to identify seasonal or periodic fluctuations in demand, as well as changes in the lead time for restocking inventory. This information can be used to adjust the laboratory's inventory management strategy to better align with the expected demand and lead times.
Summary
Lab inventory management is important in a life sciences lab because it helps to ensure that the lab has the materials and supplies needed to conduct experiments and perform other tasks. Effective inventory management can help to minimize costs by avoiding overstocking and reducing waste, while also ensuring that the laboratory has sufficient inventory on hand to meet demand without running out.
Accurate and continuous forecasting of demand and lead times allows the lab to determine the appropriate reorder point and order quantity for each item in the inventory, which can help to minimize costs and maximize the efficiency of the laboratory's operations.
To learn more about Labguru's laboratory management software

%20(4).png)