.png?height=380&name=Dashboards%20(2).png)
Boost Your research with Data-Driven Decisions
See the Big Picture from the Small Numbers
Labguru Dashboards add-on offers research teams a comprehensive overview of their data and operations allowing them to make data-driven decisions.
- Create and present visualized reports based on pre-designed SQL queries
- Accumulate data in one place and derive data-driven decisions, making your lab more efficient
- Present the dashboard within Labguru or separately on a wall screen
Labguru Dashboards – Stay on top of things & derive insights from your data
Experimental Scientific data comes in various forms and sources:
- Gather and visualize datasets to understand and compare results across experiments
- Process the query results with code scripts to answer more complex questions
Operational- Analyze operational data to increase productivity, track usage and manage processes:
- Keep up-to-date with the number of open tasks
- Analyze user in-app activity
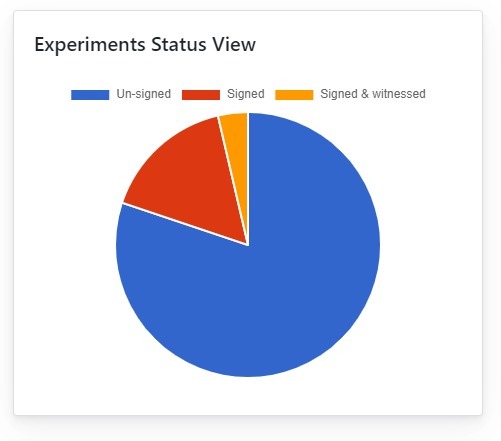
- Easily track the number of signed experiments waiting for review, saving time to gather and organise
- Know what are the most used protocols
Logistical- Understand how your team is working and if you are maximizing your resources:
- Identify lab instruments usage
- Track most used samples
- Get alerts on stocks about to expire
- Follow the number of consumed stocks per month
- Keep track of the total amount of material left
- Understand what are the most ordered items
Key Features
| SQL Query result processing via code
The query result can be further processed via code in Python, Ruby or C# |
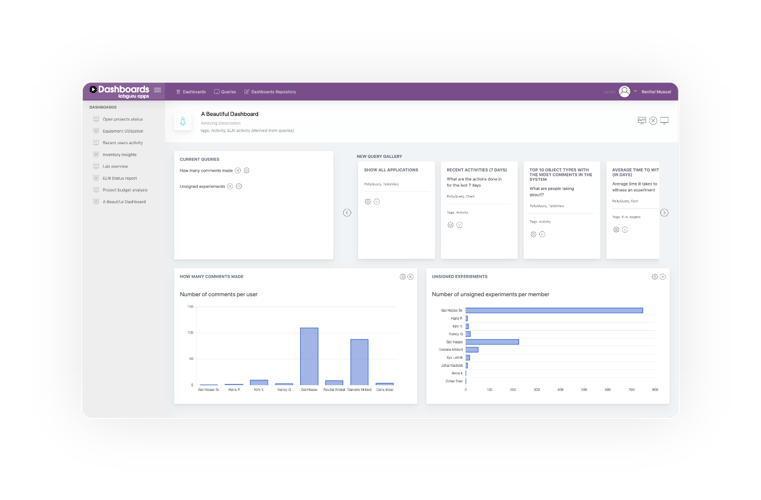
Shareable Dashboard links
Dashboards can be shared to others and viewed within Labguru or on any external screen |
Parameters can be added for dynamic dashboards
The dashboards can be filtered by various parameters which can be added to the query. The user can quickly see only relevant information (i.e. Project name, date etc) |
| Query & dashboards template repository
Simply choose from an existing collection of ready-to-use queries and dashboards and add them to your list |
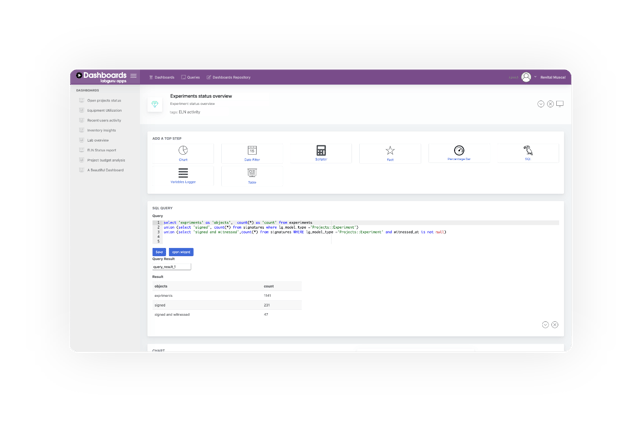
Custom SQL queries
Create new SQL based queries that can be specific to your requirements. |
Visualization options
Multiple visualization options to the query results: line/bar/column/pie/area/scatter charts. More options – Fact, percentage bar, |
Key Benefits
- Quick implementation with our pre-prepared query templates repository
- Highly customizable to your needs using SQL queries
- Extract/analyze data instantly by using python code
- Keep all lab members updated by showing the report on the Labguru home page
- Visualize data in various forms including tables, graphs, gadgets and more
Use Cases
- Create equipment utilization reports, including most used instruments, number of non-operational days per equipment, off times, equipment usage per project and more
- Get operational insights by tracking tasks completion across the lab, current workload per member, number of open assignment for each project or what is the average time to complete experiments per protocol
- Inventory insights such as most used or unused materials, samples intake and consumption rates, expiring stocks reports or material cost per month or per project.
- Experimental results instant visualization and analysis – collect data from data files and forms in Datasets and visualize them.
To learn more about Labguru Dashboards

%20(4).png)